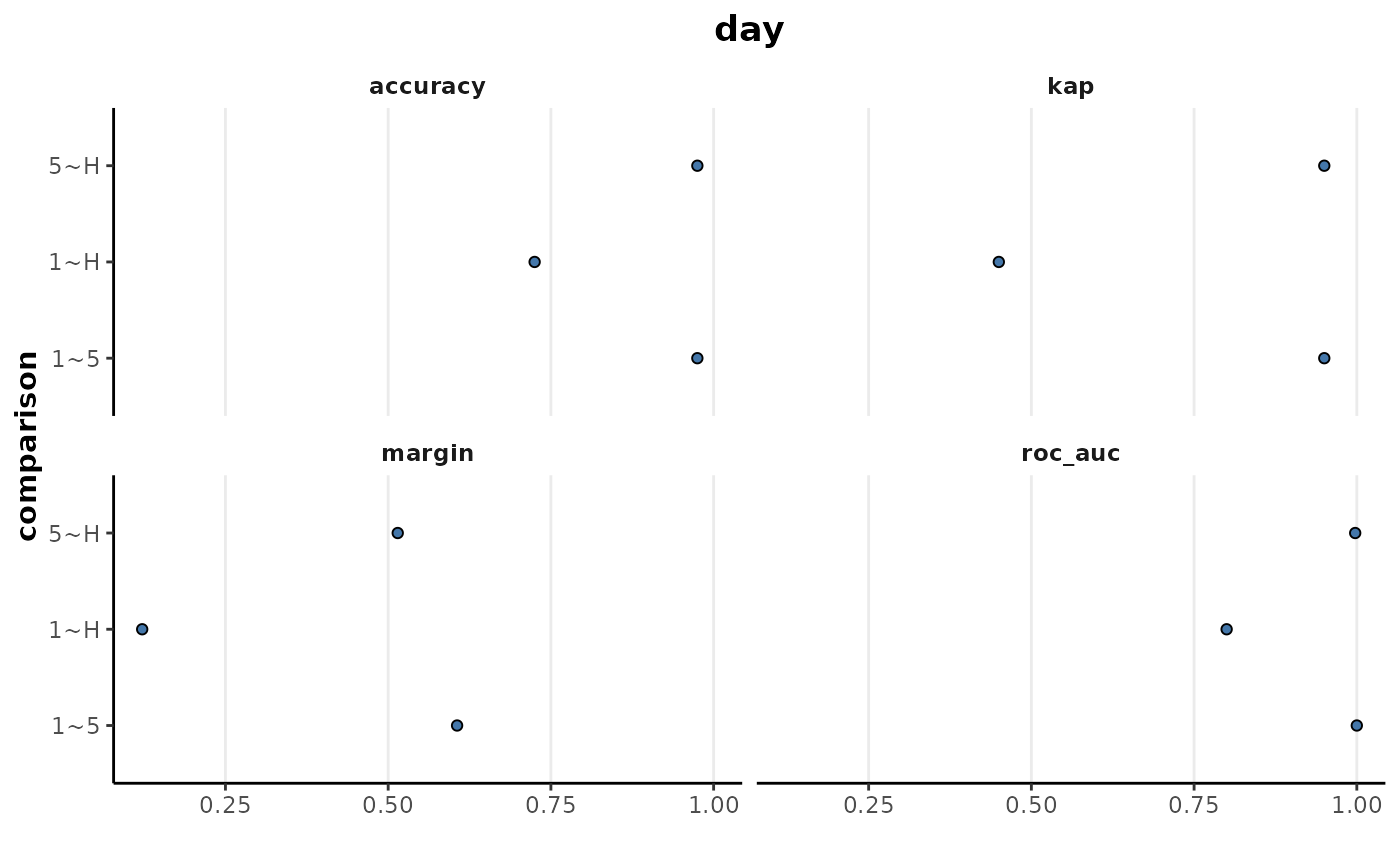
Plot random forest model performance metrics
Usage
plotMetrics(x, response = "class")

# S4 method for RandomForest
plotMetrics(x)

# S4 method for list
plotMetrics(x)Examples
library(metaboData)

x <- analysisData(abr1$neg[,200:300],abr1$fact) %>%
       keepClasses(cls = 'day',classes = c('H','1','5')) %>%
       occupancyMaximum(cls = 'day') %>%
       transformTICnorm()

rf <- randomForest(x,cls = 'day',binary = TRUE)

plotMetrics(rf,response = 'day')