Plot Univariate or random forest feature importance.
Usage
plotImportance(x, ...)

# S4 method for Univariate
plotImportance(x, response = "class", rank = TRUE, threshold = 0.05)

# S4 method for RandomForest
plotImportance(x, metric = "false_positive_rate", rank = TRUE)

# S4 method for list
plotImportance(x, metric = "false_positive_rate")
Arguments
- x
S4 object of class
UnivariateorRandomForest- ...
arguments to pass to specific method
- response
response results to plot
- rank
rank feature order for plotting
- threshold
explanatory threshold line for the output plot
- metric
importance metric to plot
Examples
library(metaboData)
x <- analysisData(abr1$neg[,200:300],abr1$fact) %>%
keepClasses(cls = 'day',classes = c('H','1','5')) %>%
occupancyMaximum(cls = 'day') %>%
transformTICnorm()
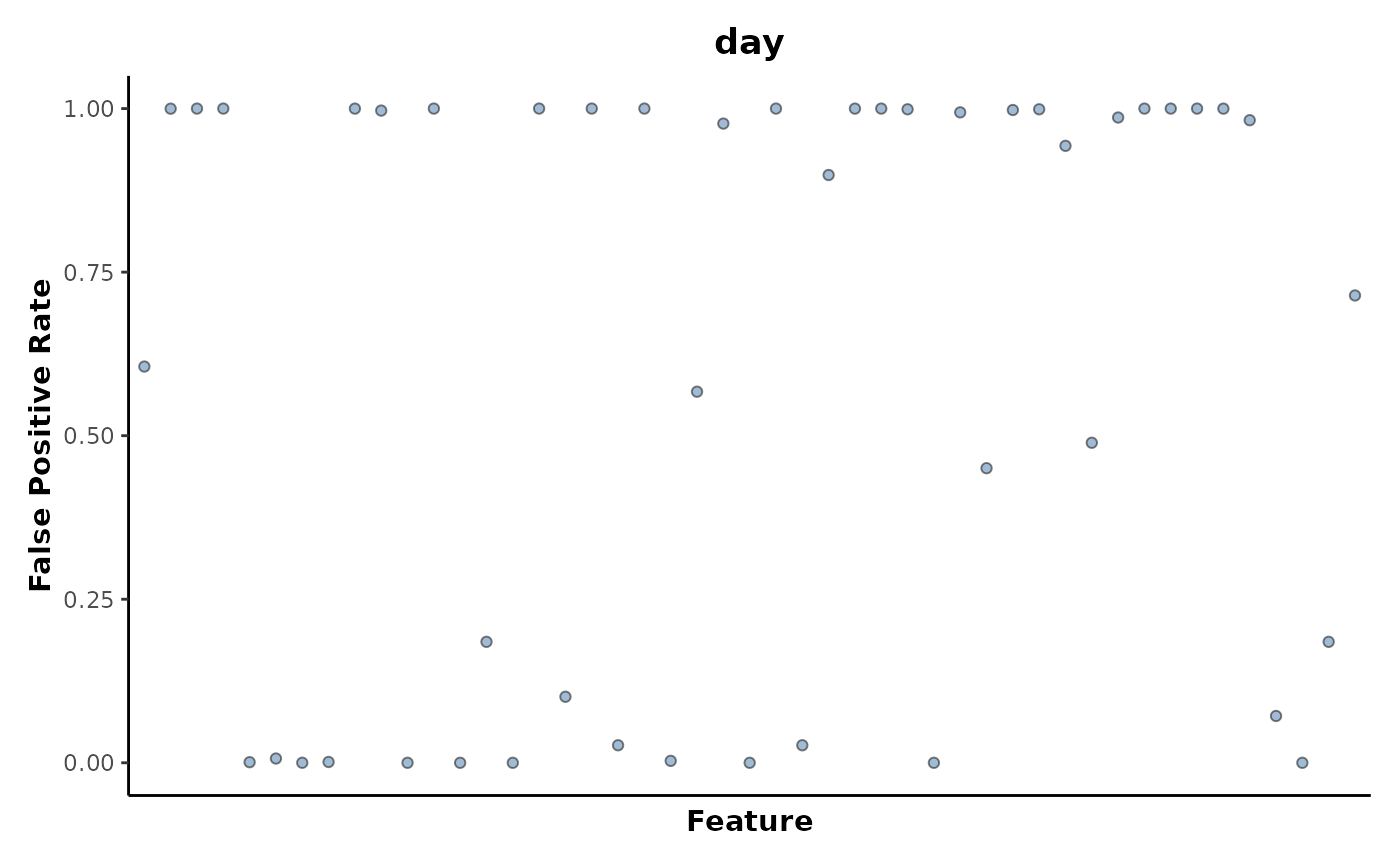
rf <- randomForest(x,cls = 'day')
plotImportance(rf,rank = FALSE)