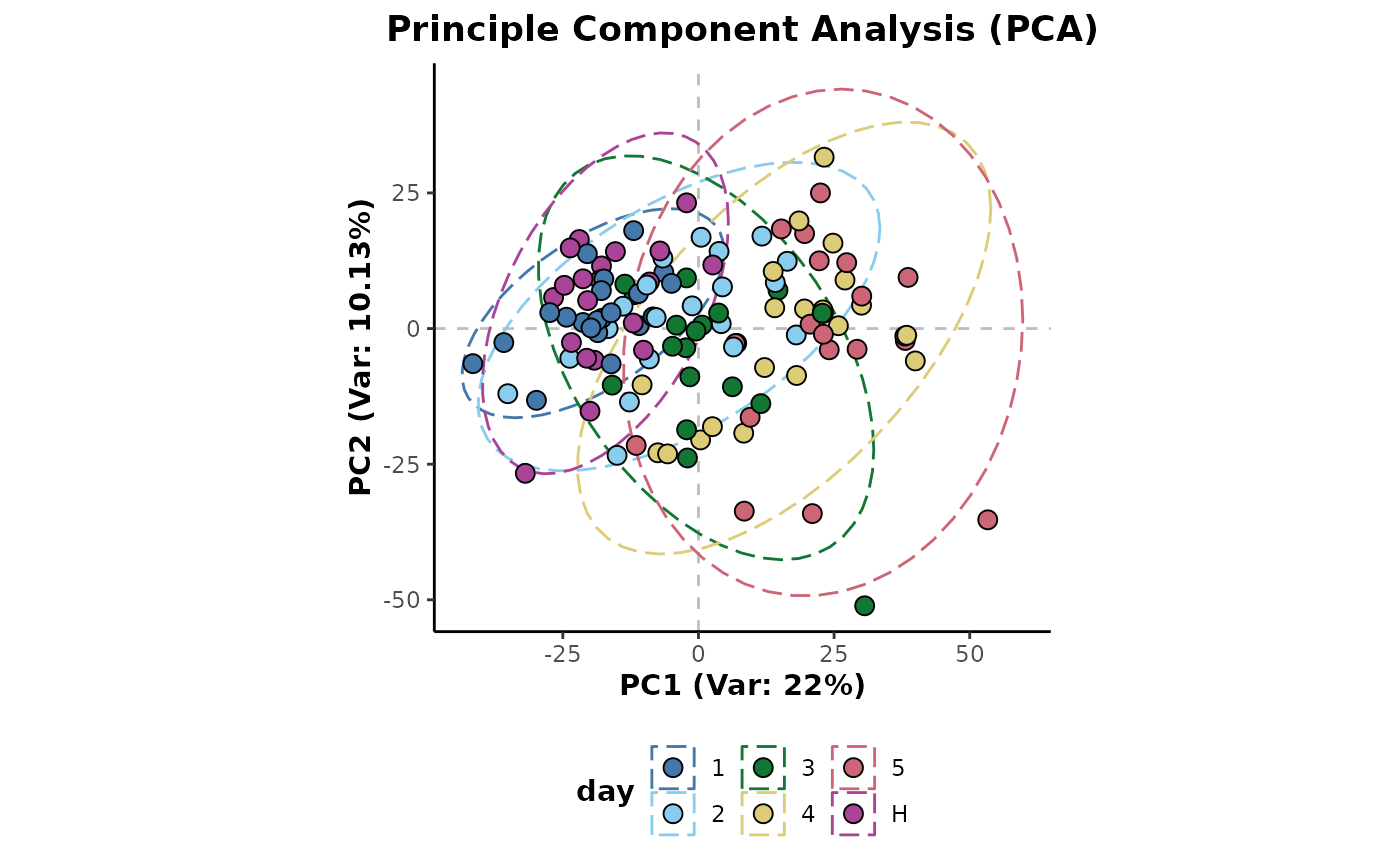
Plot Principle Component Analysis results.
Usage
plotPCA(
  analysis,
  cls = "class",
  label = NULL,
  scale = TRUE,
  center = TRUE,
  xAxis = "PC1",
  yAxis = "PC2",
  shape = FALSE,
  ellipses = TRUE,
  title = "PCA",
  legendPosition = "bottom",
  labelSize = 2,
  ...
)

# S4 method for AnalysisData
plotPCA(
  analysis,
  cls = "class",
  label = NULL,
  scale = TRUE,
  center = TRUE,
  xAxis = "PC1",
  yAxis = "PC2",
  shape = FALSE,
  ellipses = TRUE,
  title = "Principle Component Analysis (PCA)",
  legendPosition = "bottom",
  labelSize = 2
)

# S4 method for Analysis
plotPCA(
  analysis,
  cls = "class",
  label = NULL,
  scale = TRUE,
  center = TRUE,
  xAxis = "PC1",
  yAxis = "PC2",
  shape = FALSE,
  ellipses = TRUE,
  title = "PCA",
  legendPosition = "bottom",
  labelSize = 2,
  type = c("pre-treated", "raw")
)
Arguments
- analysis
object of class
AnalysisDataorAnalysis- cls
name of class information column to use for sample labelling
- label
name of class information column to use for sample labels. Set to NULL for no labels.
- scale
scale the data
- center
center the data
- xAxis
principle component to plot on the x-axis
- yAxis
principle component to plot on the y-axis
- shape
TRUE/FALSE use shape aesthetic for plot points. Defaults to TRUE when the number of classes is greater than 12
- ellipses
TRUE/FALSE, plot multivariate normal distribution 95\ confidence ellipses for each class
- title
plot title
- legendPosition
legend position to pass to legend.position argument of
ggplot2::theme. Set to "none" to remove legend.- labelSize
label size. Ignored if
labelisNULL- ...
arguments to pass to the appropriate method
- type
raworpre-treateddata to plot
Examples
library(metaboData)

d <- analysisData(abr1$neg,abr1$fact) %>%
 occupancyMaximum(cls = 'day')

## PCA plot
plotPCA(d,cls = 'day')