Plot total ion counts of sample data.
Usage
plotTIC(analysis, by = "injOrder", colour = "block", ...)

# S4 method for AnalysisData
plotTIC(analysis, by = "injOrder", colour = "block")

# S4 method for Analysis
plotTIC(
  analysis,
  by = "injOrder",
  colour = "block",
  type = c("pre-treated", "raw")
)
Arguments
- analysis
S4 object of class
AnalysisDataorAnalysis- by
information column to plot against
- colour
information column to provide colour labels
- ...
arguments to pass to the appropriate method
- type
raworpre-treatedsample data
Examples
library(metaboData)
d <- analysisData(abr1$neg,abr1$fact)
## Plot sample TIVs
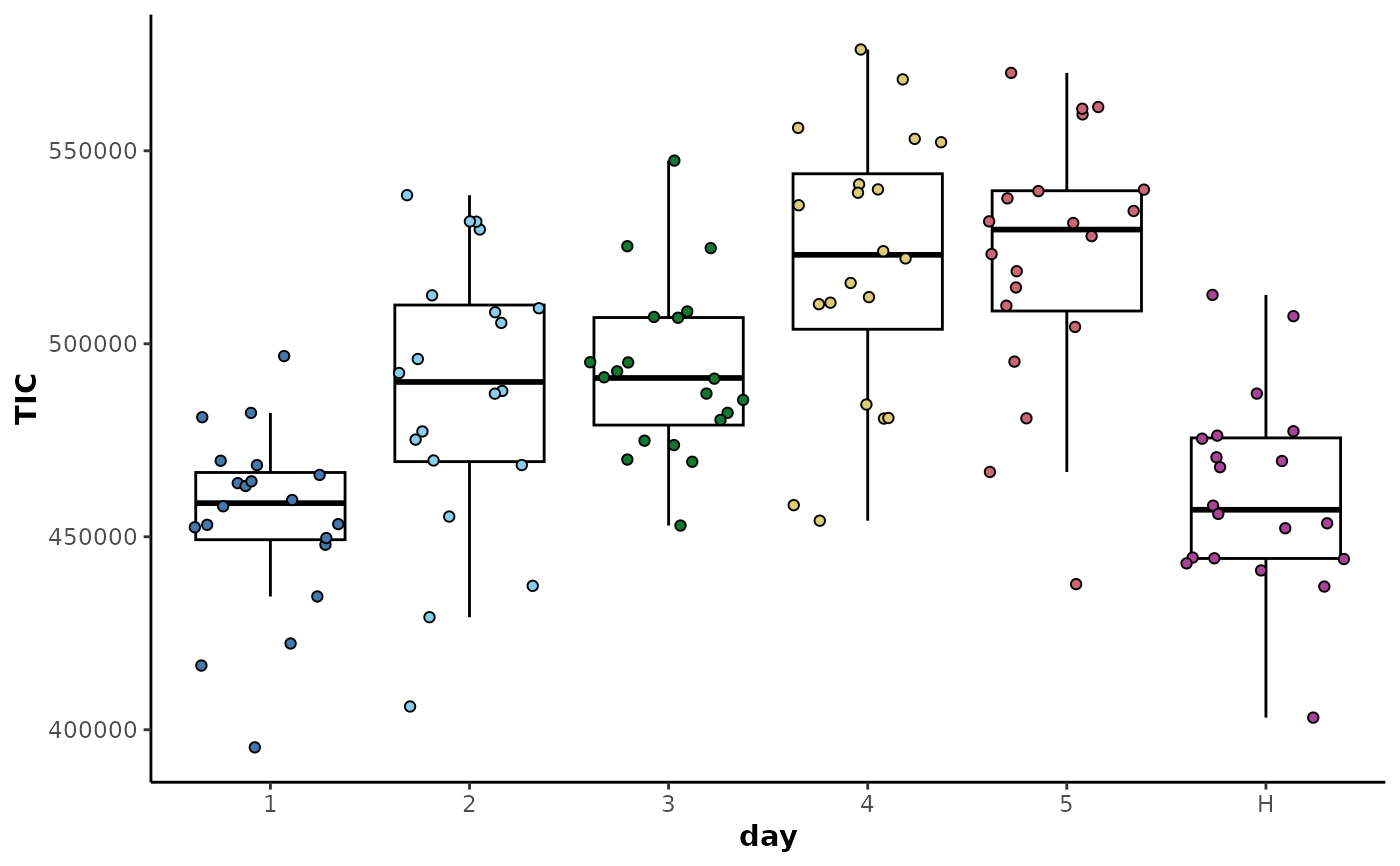
plotTIC(d,by = 'injorder',colour = 'day')
 plotTIC(d,by = 'day',colour = 'day')