Plot the trend of a feature.
Usage
plotFeature(analysis, feature, cls = "class", label = NULL, labelSize = 2, ...)

# S4 method for AnalysisData
plotFeature(analysis, feature, cls = "class", label = NULL, labelSize = 2)

# S4 method for Analysis
plotFeature(
  analysis,
  feature,
  cls = "class",
  label = NULL,
  labelSize = 2,
  type = c("pre-treated", "raw")
)
Arguments
- analysis
an object of class
AnalysisDataor`` Analysis`- feature
feature name to plot
- cls
information column to use for class labels
- label
information column to use for sample labels
- labelSize
sample label size
- ...
arguments to pass to the appropriate method
- type
raworpre-treateddata to plot
Examples
d <- analysisData(metaboData::abr1$neg,
metaboData::abr1$fact)
## Plot a categorical response variable
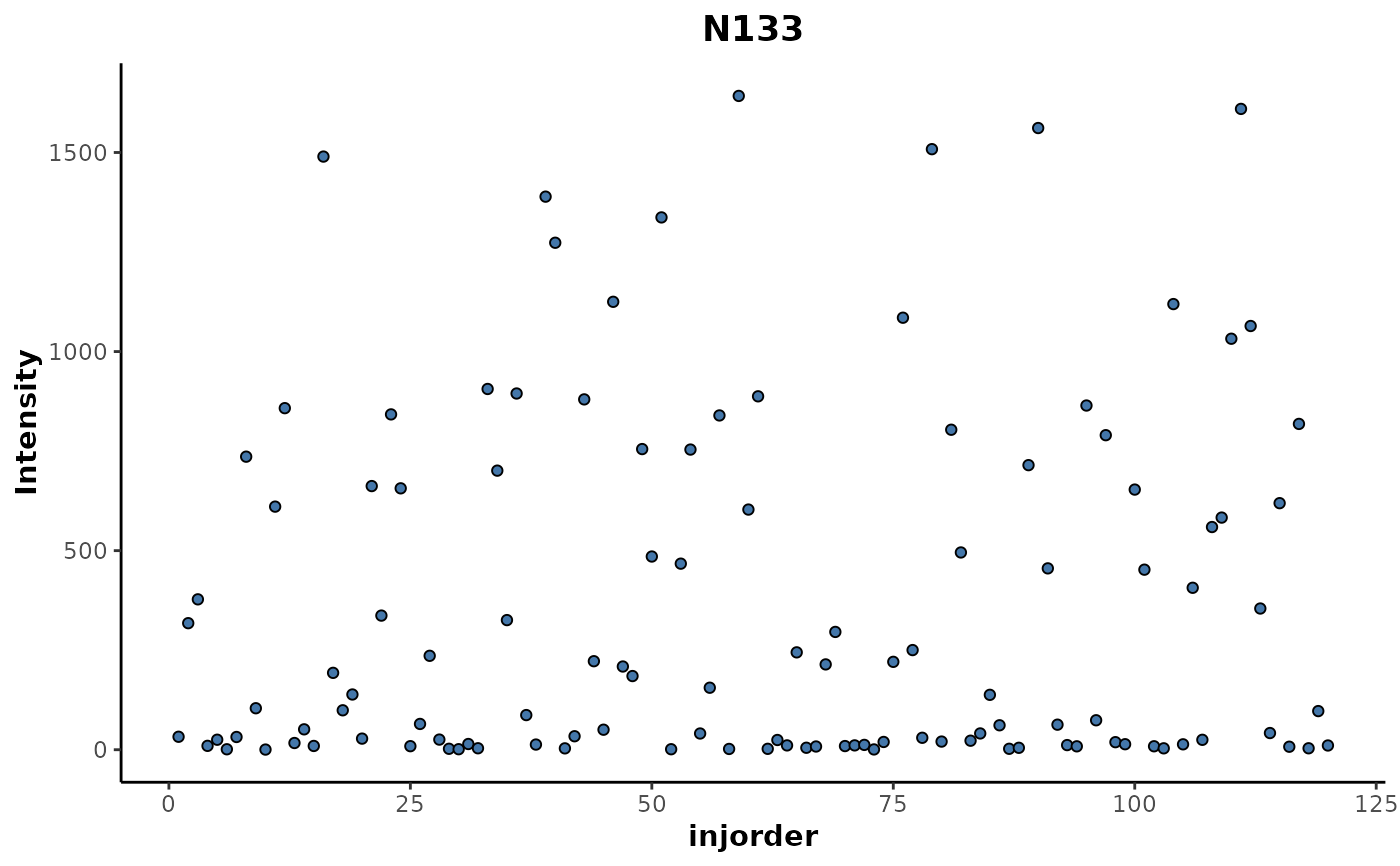
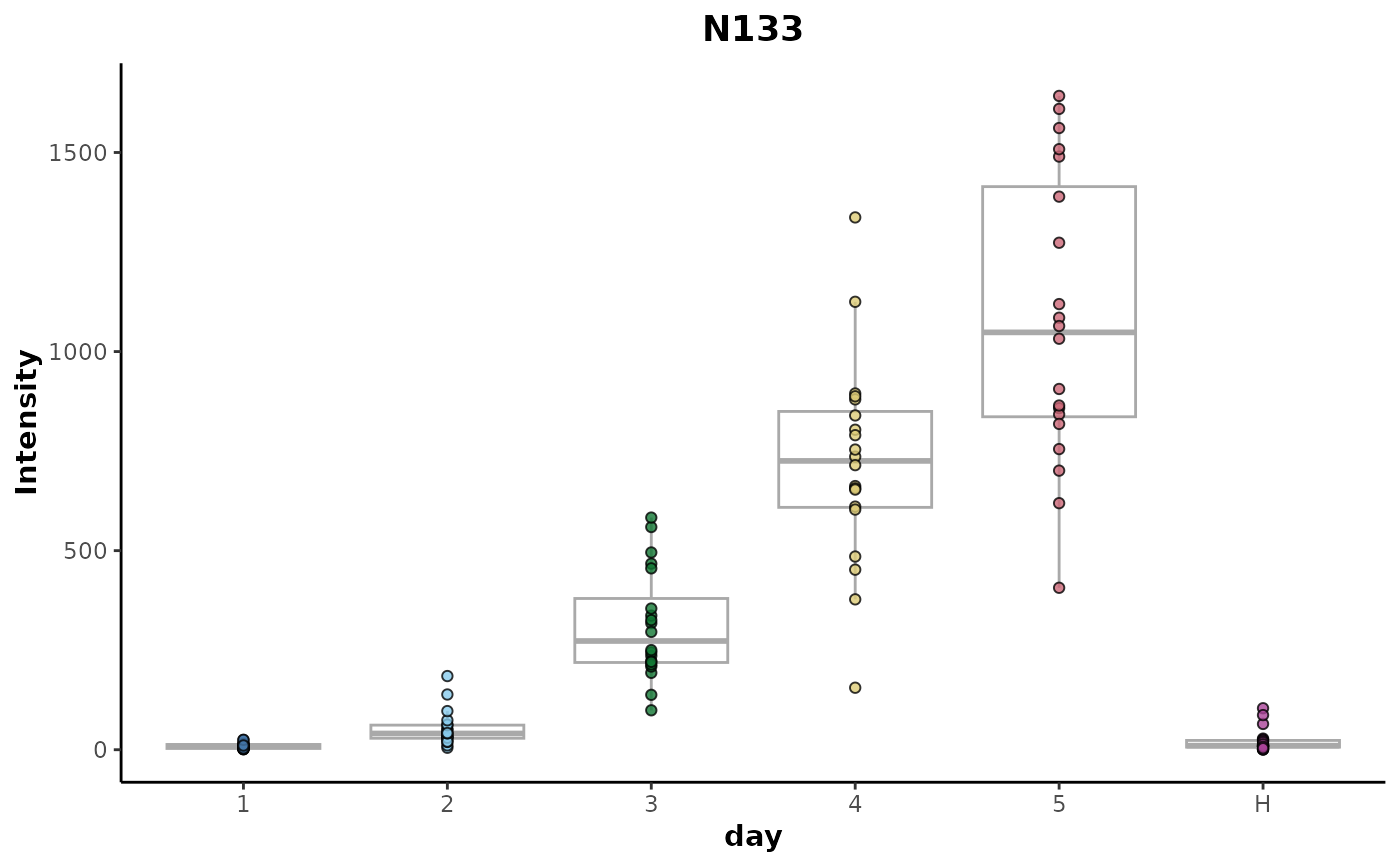
plotFeature(d,'N133',cls = 'day')
 ## Plot a continuous response variable
plotFeature(d,'N133',cls = 'injorder')
## Plot a continuous response variable
plotFeature(d,'N133',cls = 'injorder')